| Cytopenia | Status in v6.0 | Headline change |
|---|---|---|
| Neutropenia | Revised | All grade boundaries shifted; G4 reserved for ANC <100/mm³ |
| Thrombocytopenia | Revised + relabeled | G3 widened, G4 reserved for plt <10×10⁹/L; clinical qualifiers added; renamed under Blood/Lymph SOC |
| Lymphopenia | Removed from numeric grading | Recorded as present/absent; numeric grades 3-4 eliminated |
| Anemia | Unchanged | Hgb thresholds and clinical qualifiers identical to v5 |
7 CTCAE v5.0 → v6.0 What Changed for Cytopenias
A practical guide for hematology trialists, with worked re-grading examples in R
8 Why this document exists
The National Cancer Institute released CTCAE v6.0 on July 22, 2025, with planned implementation for clinical trials beginning January 1, 2026. It is the first revision since v5.0 (2017) and the first time the neutrophil grading thresholds have been touched in the criteria’s 40-year history.
For hematology trialists — and especially for those of us running studies in lower-risk MDS where cytopenias are the disease and are the most common toxicity — these are not cosmetic changes. They will:
- shift apparent Grade 3/4 event rates downward without any change in patient biology,
- break naïve cross-trial comparisons with v5-era benchmark studies (IMerge, COMMANDS, MAXILUS),
- alter dose-limiting toxicity (DLT) classification in early-phase combinations,
- change which patients are eligible at screening when criteria reference “Grade ≤1 hematologic toxicity.”
This document walks through each cytopenia in turn, supplies the exact threshold tables, and provides a runnable R script that re-grades any AE dataset under both versions and visualizes the migration. Skip to Chapter 16 if you want the code first.
NoteSource for v6 changes
v6.0 is published as an Excel workbook on the NCI CTEP site (dctd.cancer.gov/research/ctep-trials/trial-development/ctcae-v6.0.xlsx). Throughout this document, version comparisons reflect that file plus published v6 commentary in Blood Advances, JCO, and the American Journal of Hematology.
9 Headline summary
Three cytopenias changed; one did not.
The general direction of all the hematology changes is “downgrading severity to better match clinical reality.” Many counts that were Grade 4 under v5 are Grade 3 under v6. The motivation is that v5-era thresholds over-called severity in patients whose absolute numbers looked terrifying but who were clinically stable — and, in the case of neutrophils, over-flagged healthy people of African ancestry as toxic at baseline.
10 Neutropenia (Neutrophil count decreased)
10.1 The threshold change
| Grade | CTCAE v5.0 | CTCAE v6.0 | Direction |
|---|---|---|---|
| G1 | <LLN to 1,500 | <1,500 to 1,000 | Old G1 band eliminated |
| G2 | <1,500 to 1,000 | <1,000 to 500 | Shifted down a tier |
| G3 | <1,000 to 500 | <500 to 100 | Widened |
| G4 | <500 | <100 | Much stricter |
In effect, every neutropenia grade has been bumped up one level of severity. A patient whose ANC nadir was 800/mm³ was a v5 Grade 3 and is now a v6 Grade 2. A patient whose nadir was 300/mm³ was a v5 Grade 4 and is now a v6 Grade 3. Only patients with truly profound neutropenia (ANC <100/mm³) remain at Grade 4.
10.2 Why the change was necessary
The v5 lower bound for “normal” — and therefore the bottom of Grade 1 — was the institutional LLN, typically around 1,500/mm³. But the LLN for ANC is significantly lower in people of African ancestry due to the Duffy-null phenotype (DARC/ACKR1), which is present in roughly two-thirds of self-identified Black individuals. The Duffy-null LLN is closer to 1,200/mm³, with a substantial fraction of healthy adults sitting between 1,000 and 1,500/mm³ at baseline. Under v5, those healthy individuals showed up as Grade 1 or even Grade 2 neutropenic on day 1 of any trial — and were either excluded outright or “developed” toxicity that didn’t exist.
By shifting Grade 1 down to 1,000–1,500/mm³ and eliminating the LLN-anchored band, v6 makes the criteria substantially more equitable for diverse trial populations. This was the explicit motivation cited by the NCI working group.
10.3 Boundary examples
TipQuick mental model
- ANC 800 → v5 G3, v6 G2
- ANC 300 → v5 G4, v6 G3
- ANC 80 → v5 G4, v6 G4 (unchanged at the extreme)
11 Thrombocytopenia (was: Platelet count decreased)
11.1 The threshold change
| Grade | CTCAE v5.0 | CTCAE v6.0 | Direction |
|---|---|---|---|
| G1 | <LLN to 75 | <LLN to 75 | Unchanged |
| G2 | <75 to 50 | <75 to 50 | Unchanged |
| G3 | <50 to 25 | <50 to 10; transfusion indicated | Widened + clinical qualifier |
| G4 | <25 | <10; urgent intervention indicated | Much stricter + clinical qualifier |
11.2 Two changes in one
The platelet revision is doing two things simultaneously:
- Threshold shift. Grade 4 now requires platelets <10 ×10⁹/L (was <25). The 10–25 ×10⁹/L band is now Grade 3.
- Clinical reframing. The term has been moved from the Investigations SOC (“Platelet count decreased”) into Blood and lymphatic system disorders and renamed Thrombocytopenia. The grade definitions now embed clinical qualifiers — “transfusion indicated” for G3, “urgent intervention indicated” for G4 — signaling that the grade is meant to reflect a clinical disorder, not a pure lab abnormality.
The practical effect is that pure-numeric grading of platelets is no longer fully spec-compliant under v6; you should also be capturing whether a platelet transfusion was given and whether urgent intervention (e.g., hospitalization, hemostatic therapy) was required.
11.3 Boundary examples
TipQuick mental model
- Platelets 40 → v5 G3, v6 G3 (unchanged tier, but G3 now spans 10–50)
- Platelets 18 → v5 G4, v6 G3
- Platelets 8 → v5 G4, v6 G4 (unchanged at the extreme)
12 Lymphopenia
The most surprising structural change: Lymphocyte count decreased has been removed from the v6 Investigations SOC term list as a numerically graded item. Lymphopenia is now recorded as present rather than graded by lab bands. In practice, v6-era trials should not produce numeric lymphopenia grades 3 or 4 unless the protocol specifically defines its own analytic categories.
The reasoning: the v5 lymphopenia bands had poor correlation with clinical infection risk, were heavily confounded by lineage (T vs B vs NK), and produced “high-grade” events in patients who were never clinically affected. Trials that genuinely care about lymphocyte depletion (BiTEs, T-cell engagers, fludarabine-based lymphodepletion) generally define their own monitoring parameters anyway.
WarningWhat this means for safety databases
If you ingest v6 data into a pipeline that expects v5-style numeric lymphopenia grades, you will see empty cells where you used to see numbers. This is expected behavior, not a data error. Add a “version pin” to your downstream tables.
13 Anemia
| Grade | v5.0 = v6.0 |
|---|---|
| G1 | <LLN to 10.0 |
| G2 | <10.0 to 8.0 |
| G3 | <8.0; transfusion indicated |
| G4 | Life-threatening; urgent intervention indicated |
Anemia thresholds and clinical qualifiers are unchanged between v5 and v6. The published v6 commentary explicitly calls out neutrophils, platelets, and lymphocytes as the targeted hematology revisions; anemia is conspicuous by its absence from that list.
This matters for LR-MDS trials because the primary endpoint of nearly every transfusion-dependence study (RBC-TI by IWG criteria) is independent of CTCAE grading — but secondary safety tabulations of anemia events remain directly comparable across v5 and v6.
14 Cross-cutting changes that matter for MDS
Beyond the per-cytopenia thresholds, v6 introduces three structural changes that affect how MDS trials report safety:
14.1 Marrow-diagnosis double-reporting guidance
v6 includes explicit guidance discouraging the reporting of individual cell-line decreases as adverse events when a marrow diagnosis (e.g., aplastic anemia) is the underlying cause. The reasoning is that the cytopenia is the disease, and recording each ANC nadir as a separate AE artificially inflates safety tables.
The guidance is written for aplastic anemia, but the logic extends directly to MDS trials. If you are running a study where baseline cytopenias define eligibility, you should be recording worsening from baseline rather than absolute counts — otherwise every patient generates a “Grade 4 anemia” event on day 1 simply by being eligible.
14.2 MedDRA anchoring
v6 explicitly states that each CTCAE term is a MedDRA Lowest Level Term (LLT) anchored to MedDRA version 28.0. This formalizes the relationship that was implicit in v5 and matters for safety database mapping, automated coding, and downstream pharmacovigilance.
14.3 Pediatric activity language
Global grade definitions in v6 reference impact on age-appropriate normal daily activity in pediatric patients, which improves clarity for pediatric MDS trials (rare but real — especially in inherited bone marrow failure overlap syndromes).
15 Implications for current LR-MDS trials
15.1 Imetelstat / IMerge
IMerge reported its safety under v5: ~67% Grade 3/4 neutropenia and ~61% Grade 3/4 thrombocytopenia, the dominant feature of the imetelstat AE profile. Under v6:
- The overall Gr3/4 percentages will not change much because most events were already well below the v6 thresholds (ANC <500, platelets <50).
- The Gr4 fraction will drop substantially because patients with ANC 100–500 reclassify to G3 and patients with platelets 10–25 reclassify to G3.
- The headline narrative (“transient, manageable, recovers within ~4 weeks, dose modification rarely required to discontinue”) is unchanged.
For advisory-board slides comparing IMerge against newer v6-era data (e.g., elritercept post-luspatercept cohorts), always label the CTCAE version on safety tables. Re-grading the IMerge raw lab data under v6 — which the script in Chapter 16 does — produces a more honest cross-trial comparison than naïve grade-to-grade overlay.
15.2 Luspatercept / COMMANDS
Less affected because luspatercept’s signature toxicities (hypertension, fatigue, GI events, thromboembolism) are non-hematologic. The hematologic events that do occur are dominated by anemia (unchanged) and rare thrombocytopenia.
15.3 Future combinations and post-luspatercept agents
Trials launching in 2026 will use v6, including the elritercept Phase 3 in MDS, post-luspatercept imetelstat sequencing studies, and any LR-MDS combination work. DLT definitions referencing “Grade 4 hematologic toxicity” will trigger less often, which has direct implications for early-phase dose-finding decisions.
16 Re-grading IMerge-style data in R
This section gives you a complete, runnable workflow that:
- simulates an IMerge-style cohort,
- re-grades each patient under both versions,
- produces a migration matrix and two visualizations,
- prints headline shift statistics.
To use it on real data, replace simulate_nadirs() with your own dataframe — required columns are patient_id, anc (cells/mm³), plt (×10⁹/L), and hgb (g/dL), each containing per-patient nadirs.
16.1 Simulate the cohort
Code
n_patients <- 178   # IMerge enrolled n = 178

simulate_nadirs <- function(n) {
  anc_class <- sample(
    c("preserved", "mild", "moderate", "severe", "profound"),
    size = n, replace = TRUE,
    prob = c(0.20, 0.12, 0.15, 0.38, 0.15)
  )
  anc <- dplyr::case_when(
    anc_class == "preserved" ~ runif(n, 1500, 3000),
    anc_class == "mild"      ~ runif(n, 1000, 1500),
    anc_class == "moderate"  ~ runif(n, 500,  1000),
    anc_class == "severe"    ~ runif(n, 100,  500),
    anc_class == "profound"  ~ runif(n, 20,   100)
  )

  plt_class <- sample(
    c("preserved", "mild", "moderate", "severe", "profound"),
    size = n, replace = TRUE,
    prob = c(0.18, 0.10, 0.10, 0.40, 0.22)
  )
  plt <- dplyr::case_when(
    plt_class == "preserved" ~ runif(n, 100, 250),
    plt_class == "mild"      ~ runif(n, 75,  100),
    plt_class == "moderate"  ~ runif(n, 50,  75),
    plt_class == "severe"    ~ runif(n, 10,  50),
    plt_class == "profound"  ~ runif(n, 2,   10)
  )

  hgb <- rnorm(n, mean = 8.2, sd = 1.4) |> pmax(5.5) |> pmin(11.5)

  tibble(
    patient_id = sprintf("PT-%03d", seq_len(n)),
    anc        = round(anc),
    plt        = round(plt, 1),
    hgb        = round(hgb, 1)
  )
}

ae <- simulate_nadirs(n_patients)
head(ae)
# A tibble: 6 × 4
patient_id anc plt hgb
<chr> <dbl> <dbl> <dbl>
1 PT-001 1457 72.5 10
2 PT-002 74 216. 7.7
3 PT-003 41 203 8.4
4 PT-004 270 11.5 7.2
5 PT-005 303 64.8 8
6 PT-006 2031 70 9.3The mixture probabilities are calibrated so that the resulting v5 Grade 3/4 rates approximate the published IMerge frequencies. You can verify this in the headline statistics at the end.
16.2 Define the grading functions
Each function takes a numeric vector and returns an integer grade (0–4). The lln argument is exposed so you can plug in your institutional reference range.
Code
grade_anc_v5 <- function(anc, lln = 1500) {
  dplyr::case_when(
    anc <  500             ~ 4L,
    anc <  1000            ~ 3L,
    anc <  1500            ~ 2L,
    anc <  lln             ~ 1L,
    TRUE                   ~ 0L
  )
}

grade_anc_v6 <- function(anc) {
  dplyr::case_when(
    anc <  100             ~ 4L,
    anc <  500             ~ 3L,
    anc <  1000            ~ 2L,
    anc <  1500            ~ 1L,
    TRUE                   ~ 0L
  )
}

grade_plt_v5 <- function(plt, lln = 150) {
  dplyr::case_when(
    plt <  25              ~ 4L,
    plt <  50              ~ 3L,
    plt <  75              ~ 2L,
    plt <  lln             ~ 1L,
    TRUE                   ~ 0L
  )
}

grade_plt_v6 <- function(plt, lln = 150) {
  dplyr::case_when(
    plt <  10              ~ 4L,
    plt <  50              ~ 3L,
    plt <  75              ~ 2L,
    plt <  lln             ~ 1L,
    TRUE                   ~ 0L
  )
}

grade_hgb <- function(hgb, lln = 12) {  # v5 = v6
  dplyr::case_when(
    hgb <  6.5             ~ 4L,
    hgb <  8.0             ~ 3L,
    hgb <  10.0            ~ 2L,
    hgb <  lln             ~ 1L,
    TRUE                   ~ 0L
  )
}
ImportantCaveat for thrombocytopenia G3/G4
v6 platelet G3 and G4 also require clinical qualifiers (“transfusion indicated”, “urgent intervention indicated”) that pure lab-based regrading cannot capture. If your AE table includes platelet transfusion timestamps, extend grade_plt_v6() to require both the lab threshold and the qualifier. The version below is a lab-only approximation — adequate for understanding the magnitude of grade migration, but not protocol-compliant for prospective AE reporting.
16.3 Apply the regrading
Code
ae_graded <- ae |>
  mutate(
    anc_v5 = grade_anc_v5(anc),
    anc_v6 = grade_anc_v6(anc),
    plt_v5 = grade_plt_v5(plt),
    plt_v6 = grade_plt_v6(plt),
    hgb_v5 = grade_hgb(hgb),
    hgb_v6 = grade_hgb(hgb)
  )

ae_graded |>
  select(patient_id, anc, anc_v5, anc_v6, plt, plt_v5, plt_v6) |>
  head(10) |>
  kbl(booktabs = TRUE,
      caption = "First 10 patients with both v5 and v6 grades") |>
kable_styling(bootstrap_options = c("striped", "hover", "condensed"))| patient_id | anc | anc_v5 | anc_v6 | plt | plt_v5 | plt_v6 |
|---|---|---|---|---|---|---|
| PT-001 | 1457 | 2 | 1 | 72.5 | 2 | 2 |
| PT-002 | 74 | 4 | 4 | 215.6 | 0 | 0 |
| PT-003 | 41 | 4 | 4 | 203.0 | 0 | 0 |
| PT-004 | 270 | 4 | 3 | 11.5 | 4 | 3 |
| PT-005 | 303 | 4 | 3 | 64.8 | 2 | 2 |
| PT-006 | 2031 | 0 | 0 | 70.0 | 2 | 2 |
| PT-007 | 546 | 3 | 2 | 144.1 | 1 | 1 |
| PT-008 | 1518 | 0 | 0 | 6.5 | 4 | 4 |
| PT-009 | 2909 | 0 | 0 | 103.0 | 1 | 1 |
| PT-010 | 259 | 4 | 3 | 7.4 | 4 | 4 |
16.4 Migration matrix
A migration matrix is the cleanest way to see exactly which patients moved between grades. Diagonal cells = unchanged; off-diagonal cells = migrated.
Code
build_migration <- function(df, v5_col, v6_col, label) {
  df |>
    count(.data[[v5_col]], .data[[v6_col]], name = "n") |>
    rename(grade_v5 = 1, grade_v6 = 2) |>
    mutate(ae = label, .before = 1)
}

migration_long <- bind_rows(
  build_migration(ae_graded, "anc_v5", "anc_v6", "Neutropenia"),
  build_migration(ae_graded, "plt_v5", "plt_v6", "Thrombocytopenia")
)

migration_long |>
  pivot_wider(
    id_cols = c(ae, grade_v5),
    names_from = grade_v6,
    values_from = n,
    values_fill = 0,
    names_prefix = "v6_G"
  ) |>
  arrange(ae, grade_v5) |>
  gt(groupname_col = "ae", rowname_col = "grade_v5") |>
  tab_header(
    title    = md("**CTCAE v5.0 → v6.0 grade migration**"),
    subtitle = md("*Simulated IMerge-style cohort, n = 178*")
  ) |>
  tab_spanner(label = "CTCAE v6.0 grade", columns = starts_with("v6_G")) |>
  tab_stubhead(label = "v5 grade") |>
  cols_label(
    v6_G0 = "G0", v6_G1 = "G1", v6_G2 = "G2", v6_G3 = "G3", v6_G4 = "G4"
  ) |>
  data_color(
    columns = starts_with("v6_G"),
    fn = scales::col_numeric(
      palette = c("#f7fbff", "#08519c"),
      domain  = NULL
    )
  ) |>
tab_options(table.font.size = 12)| CTCAE v5.0 → v6.0 grade migration | |||||
| Simulated IMerge-style cohort, n = 178 | |||||
| v5 grade |
CTCAE v6.0 grade
|
||||
|---|---|---|---|---|---|
| G0 | G1 | G2 | G3 | G4 | |
| Neutropenia | |||||
| 0 | 37 | 0 | 0 | 0 | 0 |
| 2 | 0 | 22 | 0 | 0 | 0 |
| 3 | 0 | 0 | 28 | 0 | 0 |
| 4 | 0 | 0 | 0 | 65 | 26 |
| Thrombocytopenia | |||||
| 0 | 14 | 0 | 0 | 0 | 0 |
| 1 | 0 | 29 | 0 | 0 | 0 |
| 2 | 0 | 0 | 19 | 0 | 0 |
| 3 | 0 | 0 | 0 | 37 | 0 |
| 4 | 0 | 0 | 0 | 28 | 51 |
Read the matrix row-wise: the v5 Grade 4 row tells you where former G4 patients ended up under v6. For both ANC and platelets, you should see a substantial fraction migrating to G3.
16.5 Alluvial visualization
The alluvial plot is the single most intuitive view of the migration. Each ribbon represents patients sharing a particular (v5, v6) grade pair.
Code
alluvial_df <- bind_rows(
  ae_graded |>
    transmute(ae = "Neutropenia",      v5 = anc_v5, v6 = anc_v6),
  ae_graded |>
    transmute(ae = "Thrombocytopenia", v5 = plt_v5, v6 = plt_v6)
) |>
  count(ae, v5, v6, name = "freq") |>
  mutate(
    v5 = factor(paste0("G", v5), levels = paste0("G", 0:4)),
    v6 = factor(paste0("G", v6), levels = paste0("G", 0:4))
  )

grade_palette <- c(
  G0 = "#cfd8dc",
  G1 = "#90caf9",
  G2 = "#fdd835",
  G3 = "#fb8c00",
  G4 = "#c62828"
)

ggplot(alluvial_df, aes(axis1 = v5, axis2 = v6, y = freq)) +
  geom_alluvium(aes(fill = v5), width = 1/8, alpha = 0.85, knot.pos = 0.4) +
  geom_stratum(aes(fill = after_stat(stratum)), width = 1/8,
               color = "white", linewidth = 0.6) +
  geom_text(stat = "stratum", aes(label = after_stat(stratum)),
            size = 3.4, fontface = "bold") +
  scale_x_discrete(
    limits = c("CTCAE v5.0", "CTCAE v6.0"),
    expand = c(0.08, 0.08), position = "top"
  ) +
  scale_fill_manual(values = grade_palette, guide = "none") +
  facet_wrap(~ ae, ncol = 2) +
  labs(
    title    = "How patients move between CTCAE v5.0 and v6.0 grades",
    subtitle = "Each ribbon = patients sharing a v5/v6 grade pair",
    y        = "Patients",
    caption  = "v6 changes: ANC G4 now <100 (was <500); Platelet G4 now <10k (was <25k); G3 widened."
  ) +
  theme_clean() +
  theme(axis.text.x  = element_text(face = "bold", size = 11),
        axis.title.x = element_blank())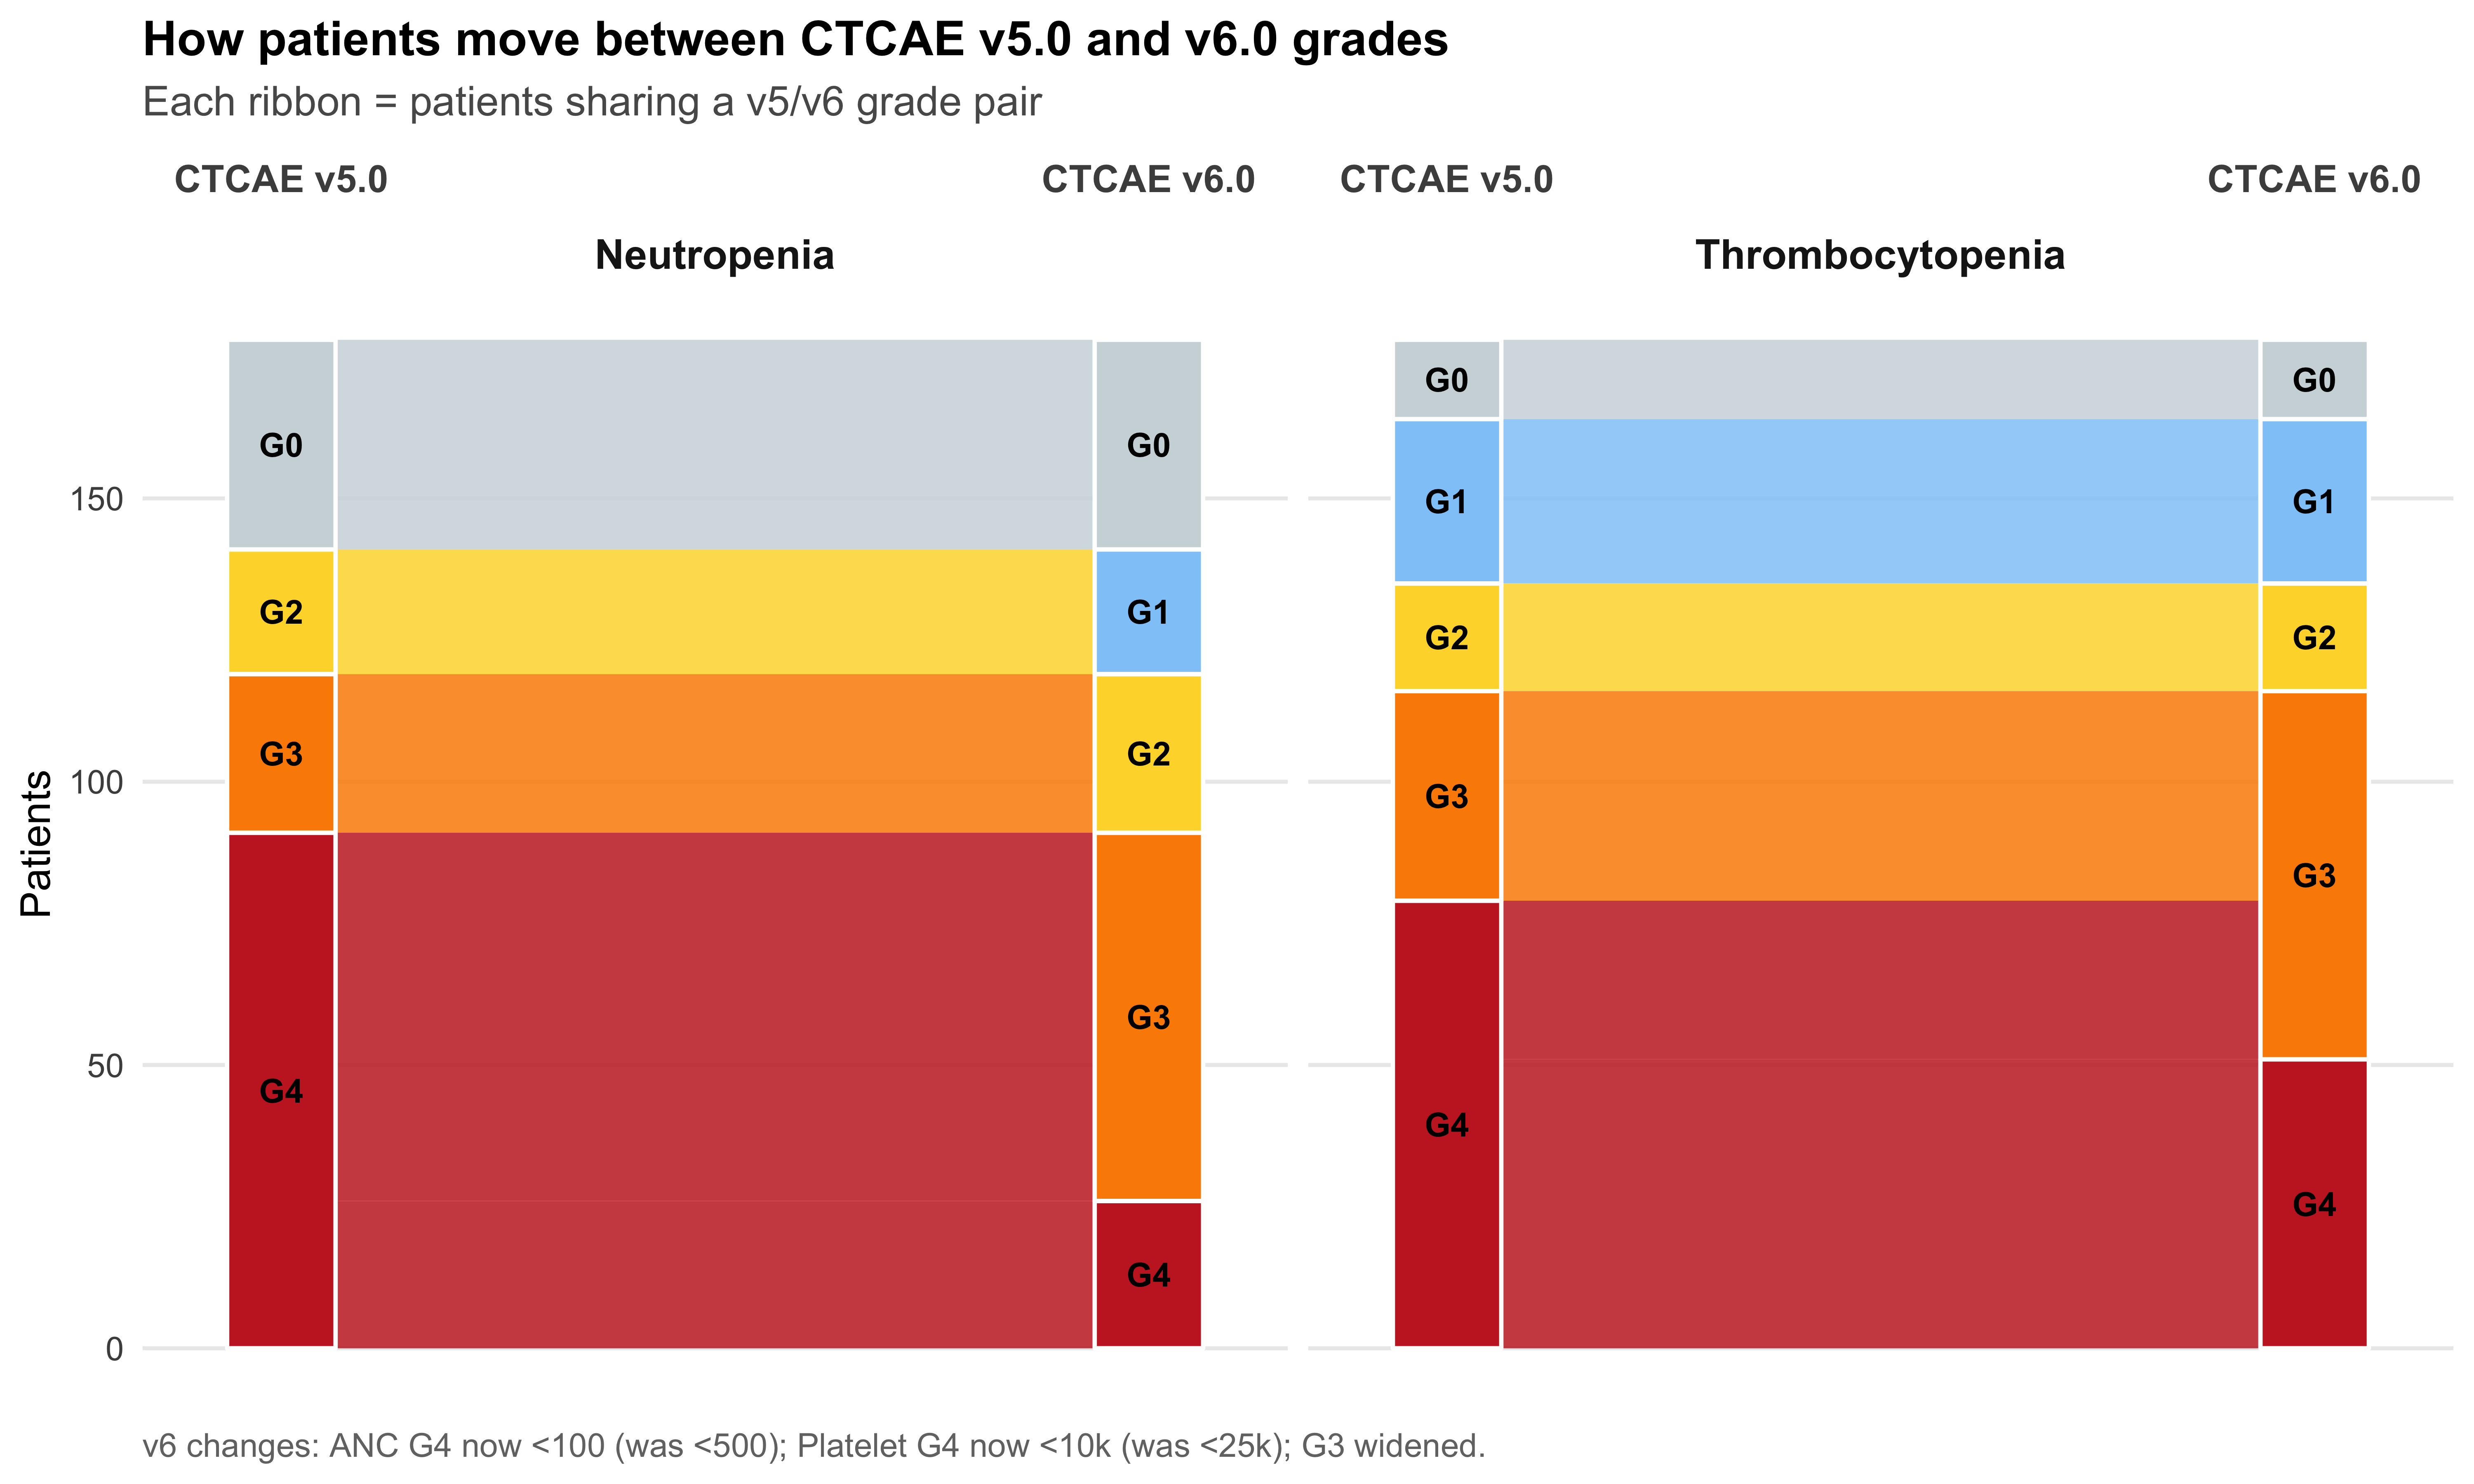
16.6 Distribution comparison
The same data viewed as paired bars — useful for slide decks where alluvials read as too “fancy” for a clinical audience.
Code
dist_df <- bind_rows(
  ae_graded |> count(grade = anc_v5) |> mutate(ae = "Neutropenia",     version = "v5.0"),
  ae_graded |> count(grade = anc_v6) |> mutate(ae = "Neutropenia",     version = "v6.0"),
  ae_graded |> count(grade = plt_v5) |> mutate(ae = "Thrombocytopenia", version = "v5.0"),
  ae_graded |> count(grade = plt_v6) |> mutate(ae = "Thrombocytopenia", version = "v6.0")
) |>
  group_by(ae, version) |>
  mutate(pct = n / sum(n)) |>
  ungroup() |>
  mutate(grade_lbl = factor(paste0("G", grade), levels = paste0("G", 0:4)))

ggplot(dist_df, aes(x = grade_lbl, y = pct, fill = version)) +
  geom_col(position = position_dodge(width = 0.75), width = 0.7) +
  geom_text(
    aes(label = scales::percent(pct, accuracy = 1)),
    position = position_dodge(width = 0.75),
    vjust = -0.4, size = 3.2, color = "grey25"
  ) +
  facet_wrap(~ ae, ncol = 2) +
  scale_y_continuous(labels = scales::percent_format(),
                     expand = expansion(mult = c(0, 0.15))) +
  scale_fill_manual(
    values = c("v5.0" = "#90a4ae", "v6.0" = "#1565c0"),
    name   = "CTCAE version"
  ) +
  labs(
    title    = "Grade distribution shifts under CTCAE v6.0",
    subtitle = "Same patients, two grading systems",
    x = NULL, y = "Percent of patients"
  ) +
  theme_clean()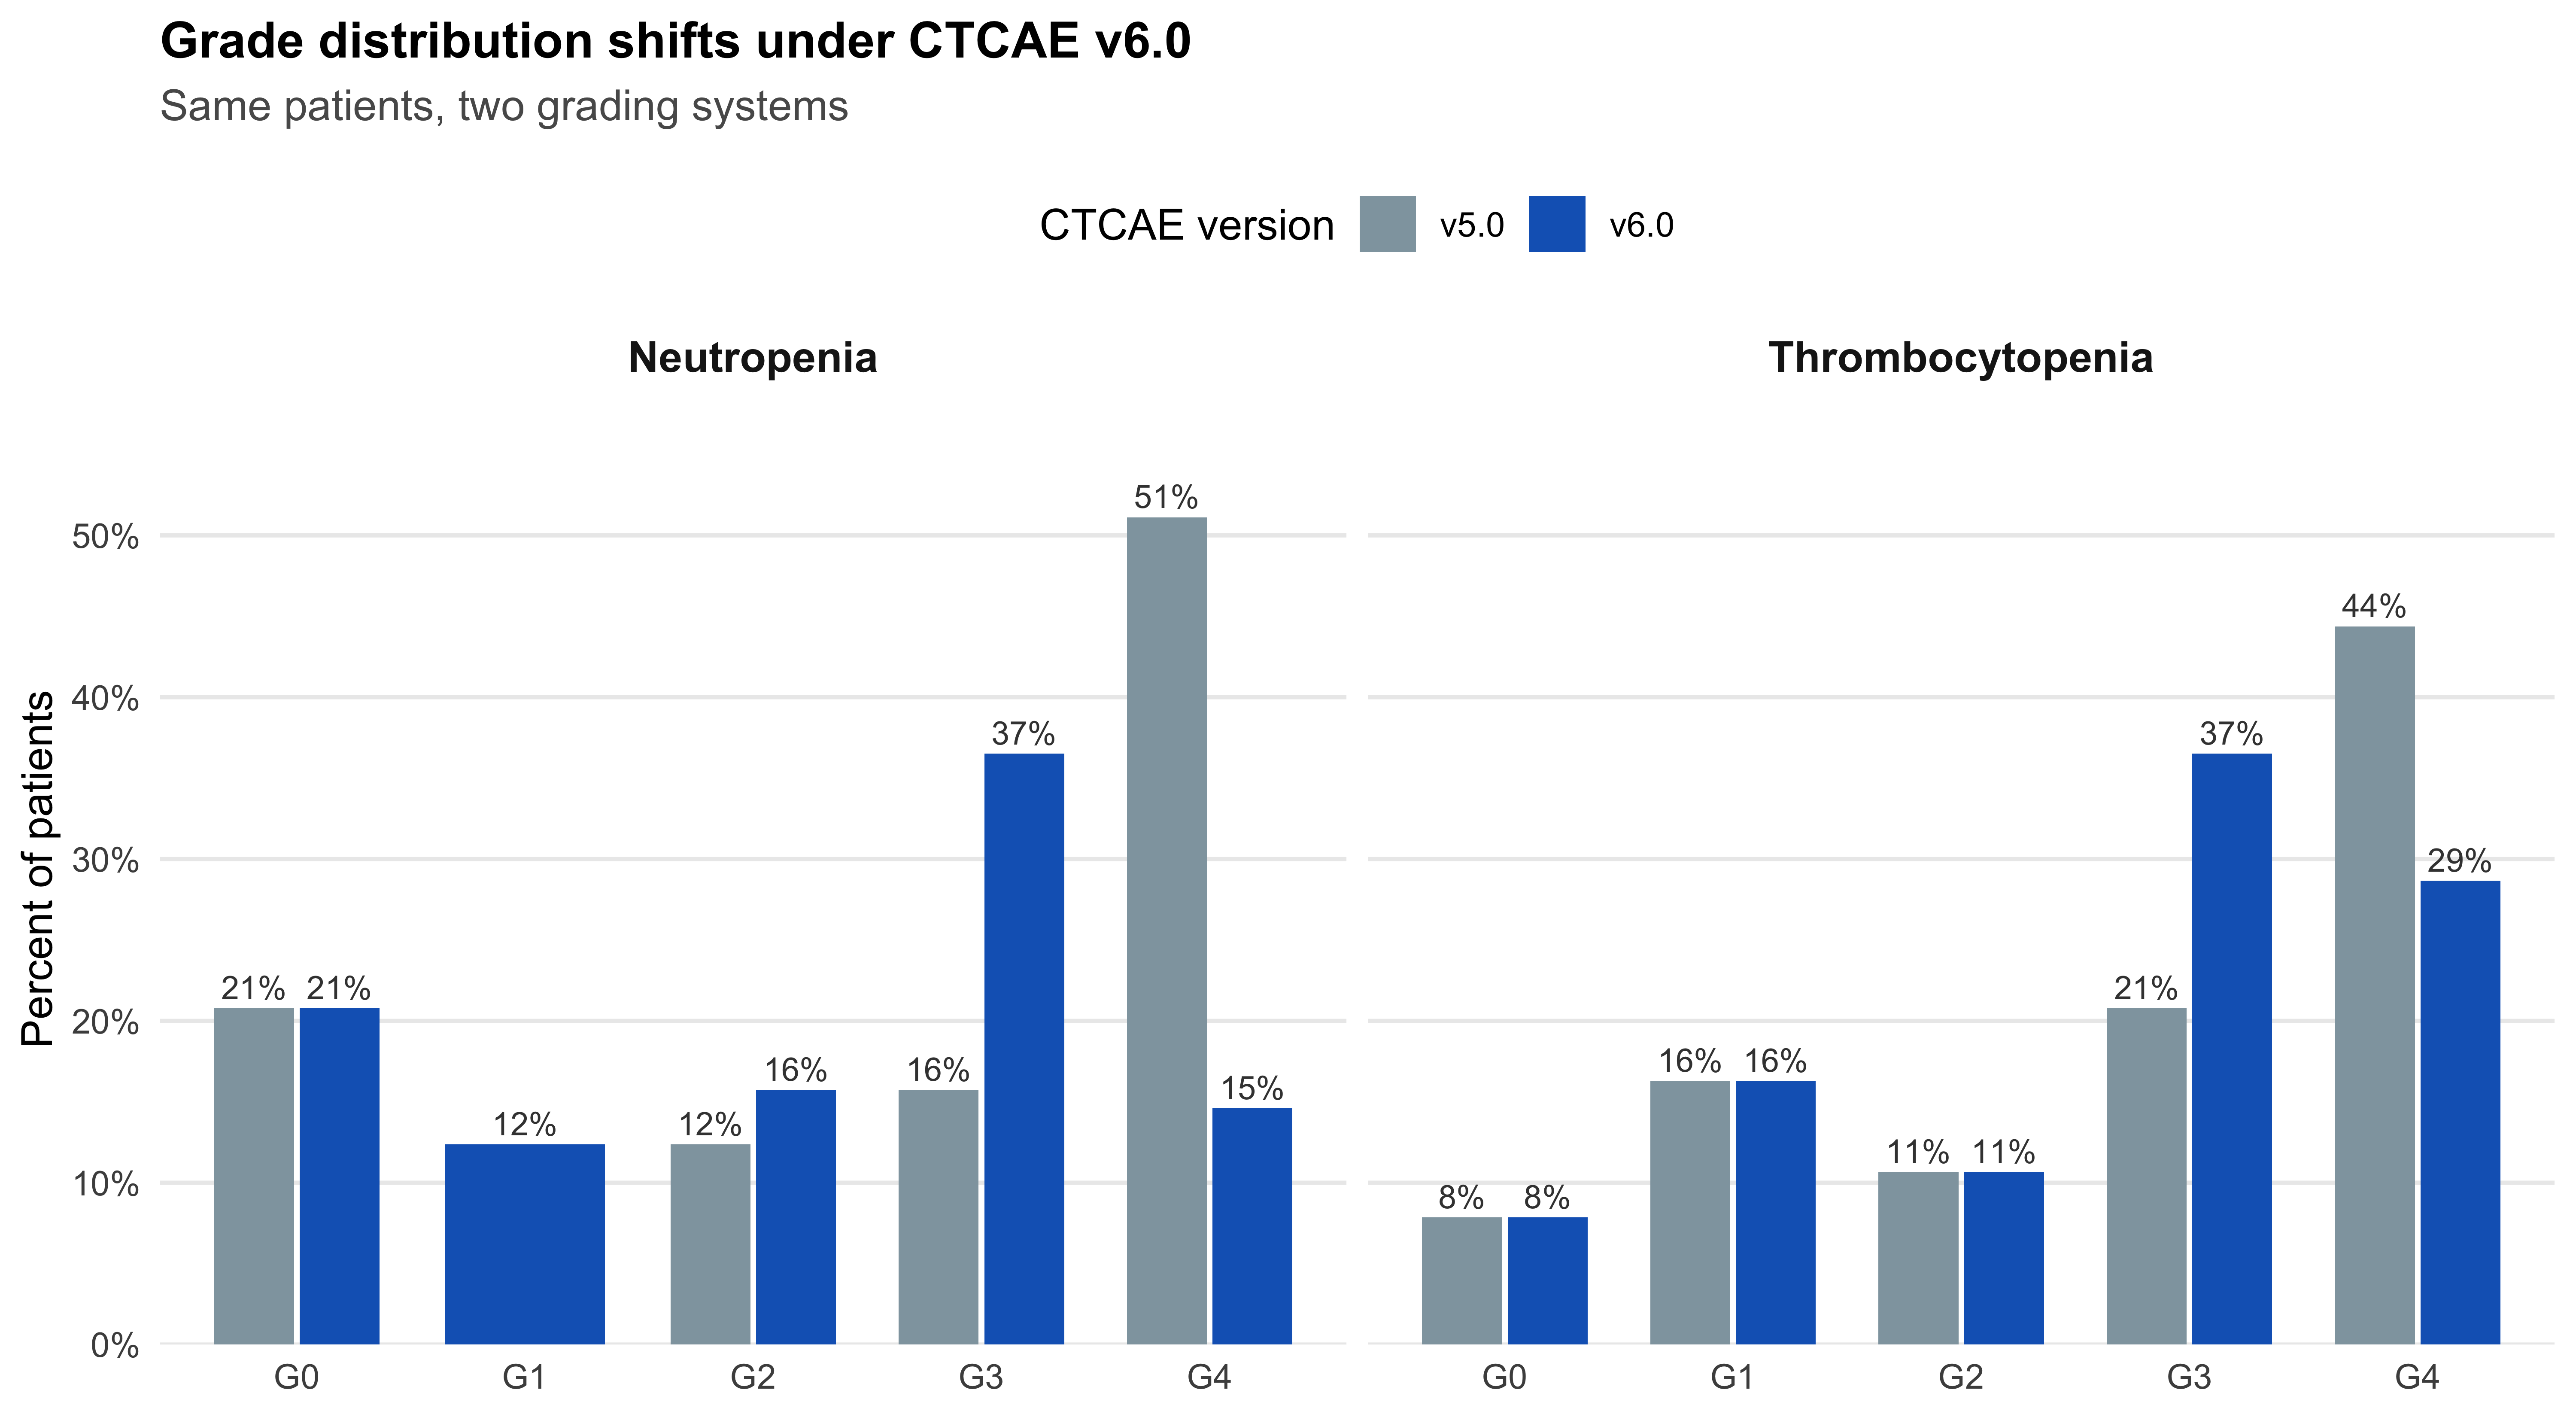
16.7 Headline shift statistics
Code
ae_graded |>
  summarise(
    `ANC G3/4 v5 (%)` = mean(anc_v5 >= 3) * 100,
    `ANC G3/4 v6 (%)` = mean(anc_v6 >= 3) * 100,
    `ANC G4 v5 (%)`   = mean(anc_v5 == 4) * 100,
    `ANC G4 v6 (%)`   = mean(anc_v6 == 4) * 100,
    `PLT G3/4 v5 (%)` = mean(plt_v5 >= 3) * 100,
    `PLT G3/4 v6 (%)` = mean(plt_v6 >= 3) * 100,
    `PLT G4 v5 (%)`   = mean(plt_v5 == 4) * 100,
    `PLT G4 v6 (%)`   = mean(plt_v6 == 4) * 100
  ) |>
  pivot_longer(everything(), names_to = "Metric", values_to = "Percent") |>
  mutate(Percent = round(Percent, 1)) |>
  kbl(booktabs = TRUE) |>
  kable_styling(bootstrap_options = c("striped", "hover", "condensed"),
full_width = FALSE)| Metric | Percent |
|---|---|
| ANC G3/4 v5 (%) | 66.9 |
| ANC G3/4 v6 (%) | 51.1 |
| ANC G4 v5 (%) | 51.1 |
| ANC G4 v6 (%) | 14.6 |
| PLT G3/4 v5 (%) | 65.2 |
| PLT G3/4 v6 (%) | 65.2 |
| PLT G4 v5 (%) | 44.4 |
| PLT G4 v6 (%) | 28.7 |
The most striking number to flag in any advisory-board slide is the G4 rate, which is the metric most influenced by the version change. If your v5-era IMerge slide showed ~33% Grade 4 neutropenia, the same data re-graded under v6 will look meaningfully different — and a reviewer who isn’t paying attention to the version label may misinterpret that as a safety improvement.
17 Practical recommendations
TipFor protocol writers
- State the CTCAE version explicitly in the protocol, statistical analysis plan, and every safety output. Make it part of the table footnote, not an assumption.
- Re-anchor DLT definitions. A protocol that defines DLT as “any Grade 4 hematologic toxicity” will trigger far less often under v6. If that’s not the intent, redefine DLT in terms of raw lab thresholds (e.g., “ANC <100/mm³ for >7 days”) rather than CTCAE grade.
- Pre-specify the regrading strategy for any cross-version comparison in your SAP. Document whether you will (a) re-grade historical lab data under v6 thresholds, (b) stratify analyses by CTCAE version, or (c) report only stable primitives (raw lab nadirs and clinical sequelae).
TipFor analysts
- Always preserve raw lab values alongside computed grades. Grades are versioned; raw labs are stable.
- Add version pins to downstream exports. A common failure mode is a v6 study feeding a downstream analytics layer that assumes v5 because that was the legacy default.
- Build “unit tests” for safety data. For neutrophils, scan for any cases where ANC is between 100 and 500 and the dataset reports Grade 4 under a v6 study — those are strong candidates for v5 logic leaking into a v6 build.
TipFor clinicians and trial PIs
- Train your CRCs deliberately. Most grading variation comes from habit. Short, case-based training with concrete boundary examples (ANC 300; platelets 18 with and without transfusion) is the fastest way to restore consistency across sites.
- Don’t compare v5 grades and v6 grades as if they were equivalent. When presenting safety tables to leadership, DSMBs, or external partners, include one sentence making the definitional point, then immediately show stable comparators (raw labs and clinically meaningful sequelae like febrile neutropenia, transfusions, hospitalization).
18 Session info
R version 4.6.1 (2026-06-24)
Platform: aarch64-apple-darwin23
Running under: macOS Tahoe 26.6

Matrix products: default
BLAS:   /Library/Frameworks/R.framework/Versions/4.6/Resources/lib/libRblas.0.dylib
LAPACK: /Library/Frameworks/R.framework/Versions/4.6/Resources/lib/libRlapack.dylib;  LAPACK version 3.12.1

locale:
[1] en_US.UTF-8/en_US.UTF-8/en_US.UTF-8/C/en_US.UTF-8/en_US.UTF-8

time zone: America/Chicago
tzcode source: internal

attached base packages:
[1] stats     graphics  grDevices utils     datasets  methods   base

other attached packages:
[1] kableExtra_1.4.1  forcats_1.0.1     scales_1.4.0      gt_1.3.0
[5] ggalluvial_0.12.6 ggplot2_4.0.3     tidyr_1.3.2       dplyr_1.2.1

loaded via a namespace (and not attached):
 [1] sass_0.4.10        utf8_1.2.6         generics_0.1.4     xml2_1.6.0
 [5] stringi_1.8.7      digest_0.6.39      magrittr_2.0.5     evaluate_1.0.5
 [9] grid_4.6.1         RColorBrewer_1.1-3 fastmap_1.2.0      jsonlite_2.0.0
[13] purrr_1.2.2        viridisLite_0.4.3  textshaping_1.0.5  cli_3.6.6
[17] rlang_1.3.0        litedown_0.10      commonmark_2.0.0   base64enc_0.1-6
[21] withr_3.0.3        yaml_2.3.12        otel_0.2.0         tools_4.6.1
[25] vctrs_0.7.3        R6_2.6.1           lifecycle_1.0.5    stringr_1.6.0
[29] fs_2.1.0           htmlwidgets_1.6.4  pkgconfig_2.0.3    pillar_1.11.1
[33] gtable_0.3.6       glue_1.8.1         systemfonts_1.3.2  xfun_0.60
[37] tibble_3.3.1       tidyselect_1.2.1   rstudioapi_0.19.0  knitr_1.51
[41] farver_2.1.2       htmltools_0.5.9    labeling_0.4.3     rmarkdown_2.31
[45] svglite_2.2.2      compiler_4.6.1     S7_0.2.2           markdown_2.0
Document prepared August 19, 2026. Source: NCI CTEP CTCAE v6.0 Excel workbook (released July 22, 2025); v6 commentary in Blood Advances, JCO, and American Journal of Hematology* (2025–2026). Anemia thresholds verified as unchanged based on absence from published v6 hematology revision lists; users running protocols should cross-check directly against the CTEP Excel.*